
America's Worst Cities for Allergies Right Now — and Why the List Moves
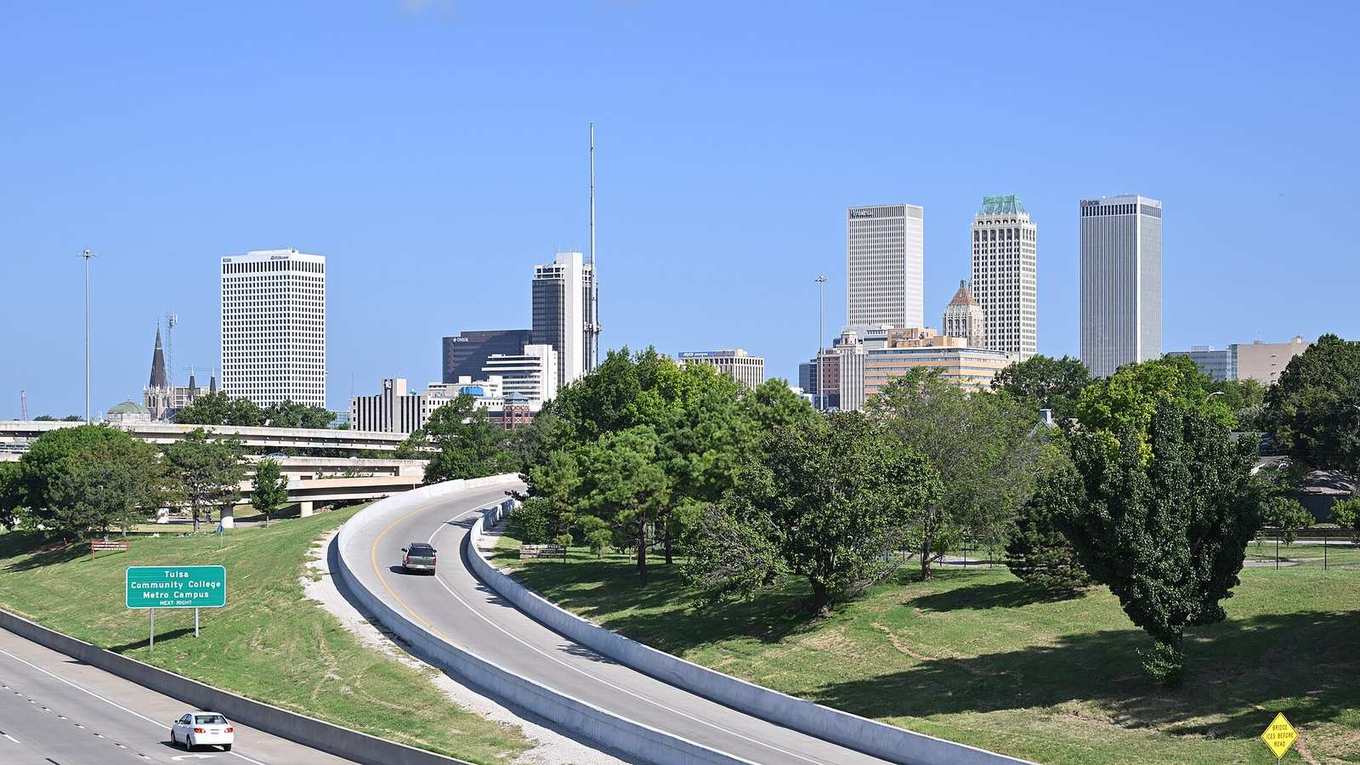
Every spring, a headline lands: these are the worst cities for allergies in America. Every fall, a different set of cities seems to be suffering the most. And on any given week, the city at the top of one list is nowhere near the top of another.
All three can be true at once, because "worst city for allergies" is not one question. It is at least two. One asks which places are hardest to live in with allergies across a whole year. The other asks a narrower, more urgent question: where is the pollen worst right now? It was published in mid-October, during the tail of ragweed season — and, as you will see, the date on a ranking matters as much as the ranking itself.
The annual list: what "allergy capitals" actually measures
The best-known ranking is the Allergy Capitals report from the Asthma and Allergy Foundation of America (AAFA), published annually since 2003. It ranks the 100 most populous metropolitan areas in the contiguous United States, and — this is the part most headlines skip — pollen is only part of its score.
AAFA's methodology combines pollen scores for tree, grass, and weed pollen with two non-pollen factors: over-the-counter allergy medication use, and the number of allergy specialists available in the area. Each factor is weighted, the most recent 12 months of data are used, and cities are ranked from the highest combined score (ranked #1, the most challenging) to the lowest. In other words, the annual list measures the overall burden of living with allergies in a place — exposure plus how much relief people there are buying, adjusted for how much specialist care is available. It is a year-in-review, built from the previous year's data, not a snapshot of today's air.
Its recent results show how much a year can change. In AAFA's 2026 report, the top five were Boise, Idaho; San Diego, California; Tulsa, Oklahoma; Provo, Utah; and Rochester, New York, with Wichita, Kansas, and Raleigh, North Carolina, also in the top ten. Just a year earlier, the 2025 top five had been Wichita; New Orleans, Louisiana; Oklahoma City, Oklahoma; Tulsa; and Memphis, Tennessee. Boise's jump was the most dramatic in the 2026 report: it rose from 95th in 2025 to 1st in 2026, which AAFA attributed largely to tree pollen peaking earlier, grass pollen starting earlier and lasting longer, and weed pollen lasting longer and peaking higher. A ranking that can move 94 places in a year is not broken — it is telling you that pollen seasons are weather stories, and weather does not repeat itself on schedule.
The daily list: a different question, answered differently
Pollen Atlas publishes a different kind of ranking: the daily city rankings, which order cities by the pollen actually in the air on a given day. Each city is scored on a Total Pollen Index from 0 to 100 — Low from 0 to 33, Moderate from 34 to 66, and High from 67 to 100 — with separate Tree, Grass, and Weeds indexes underneath the total, and the day's dominant allergen named. (If the index itself is new to you, our explainer on what a pollen count is walks through how numbers like these are built.)
Because the daily ranking scores only pollen, it answers only the "right now" question — and it is supposed to move. Pollen Atlas data shows fall rankings shifting the most during the ragweed peak weeks of September, when neighbouring regions hit their worst days on different dates. A city can sit near the top on a warm, windy Tuesday and fall out of the top twenty by the weekend after rain moves through. That volatility is not noise. It is the honest shape of a daily measurement, and it is why this post does not print a fixed "today's top five": by the time you read it, the accurate list is the one on the rankings page, dated today.
Why the list moves: four forces
1. The season rotates, so the map rotates. Different pollens own different months. Tree pollen dominates late winter and spring, grass takes over in late spring and summer, and weeds — ragweed above all — own late summer and fall. A daily ranking in April is mostly a story about the South and mid-Atlantic, where trees pollinate first. The same ranking in September is mostly a story about the Midwest and central plains. The "worst city" in spring and the "worst city" in fall are usually worst for entirely different plants.
2. Weather rewrites the ranking daily. Pollen release and travel are weather events. Warm, dry, windy days lift pollen and keep it airborne; rain washes it out of the air temporarily; a cold front can trigger a sudden release from some plants and shut others down. Two cities with identical plants can post completely different indexes on the same day because one had wind and the other had rain.
3. Geography loads the dice. Some regions simply grow more of the most allergenic plants. The central plains sit in the heart of ragweed country, surrounded by the farmland, field edges, and open ground where ragweed thrives. The Southeast combines a long growing season with dense tree cover. Mountain and coastal cities often benefit from terrain and onshore air that dilute pollen. Geography explains why certain names recur on these lists year after year — and weather explains why they swap places.
4. Timing is local. Pollen seasons start earlier in the South and later in the North, and end at the first frost — which arrives weeks apart across the country. At any moment, one region may be at its peak while another has not started and a third is already done. A national daily list is a photograph of those overlapping calendars, not a verdict on the cities in it.
The fall cohort: the names to watch in ragweed season
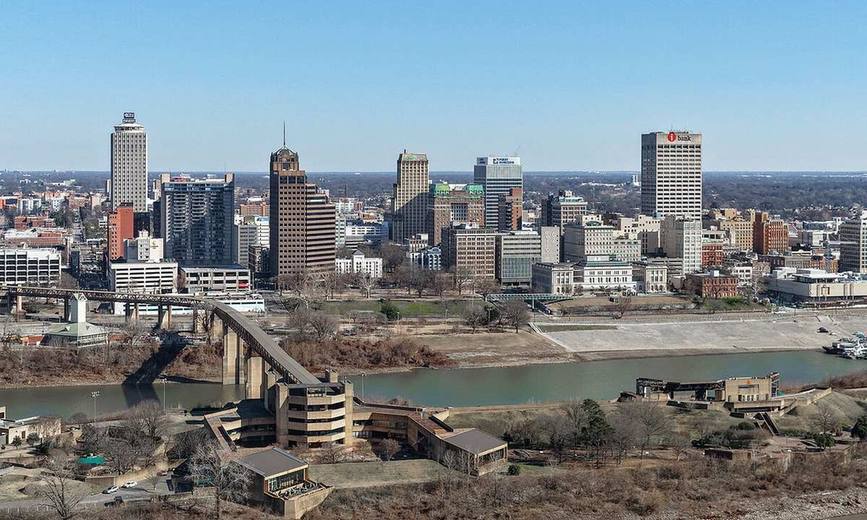
Because this post is published in October, the most useful snapshot is seasonal rather than daily: the group of cities that fall rankings return to again and again. Pollen Atlas data shows Tulsa's pollen levels regularly reaching the top of the fall rankings when ragweed peaks, and Tulsa's consistency shows in the annual record too — it placed in AAFA's top five in both 2025 and 2026. Nearby Oklahoma City's daily pollen shares the same plains exposure and anchored the 2025 annual top five alongside it.
Wichita's pollen page tells a similar story: Wichita topped AAFA's 2025 list outright and stayed in the 2026 top ten, which is what you would expect from a city surrounded by ragweed-friendly open ground in every direction. Further southeast, Memphis pollen levels reflect the South's longer season — ragweed starts earlier there, and the first frost that ends it arrives later, so Memphis can stay in the fall conversation weeks after northern cities have finished. And Raleigh's daily pollen represents the Southeast's tree-and-ragweed combination: a strong spring tree season followed by a meaningful fall, which helped it into AAFA's 2026 top ten.
None of these cities is "the worst" every day. Together, they are the fall cohort — the places where the season's structure makes high daily rankings most likely, and where checking the daily number matters most. For the full seasonal picture behind the fall list, see our guide to ragweed season and when it peaks.
How to use each list
Use the annual Allergy Capitals list for annual decisions: understanding which regions carry a heavy year-round burden, and context if you are comparing places to live or visit across seasons. Read it knowing it blends pollen with medication use and specialist supply, and that it describes last year's data.
Use the daily ranking for daily decisions: whether today is a high day in your city, whether your city's bad day is a local spike or part of a regional peak, and which pollen type is driving it — the split between Tree, Grass, and Weeds indexes matters more than the total if you know which one affects you. Start from the city rankings, then open your own city's page for its 5-day forecast, because a ranking tells you where you stand today and a forecast tells you what to plan around tomorrow.
If your city appears near the top of either list season after season and symptoms are a recurring part of your year, that pattern is worth discussing with a specialist who can test which pollens actually affect you. You can find an allergist near you in the Pollen Atlas directory. This article is general information only and is not medical advice.
The bottom line
There is no permanent "worst city for allergies" — there is a hardest year, measured annually, and a worst day, measured daily, and the two lists agree less often than the headlines suggest. The annual capitals tell you where the burden concentrates over time. The daily rankings tell you where the pollen is, today, and which plant put it there. Check the list that matches the decision you are making, check the date on it before you trust it, and let the daily numbers — not last spring's headline — plan your week.
Sources
- Asthma and Allergy Foundation of America, 2026 Allergy Capitals Report (aafa.org / allergycapitals.org; ranking of 100 metropolitan areas; factors: tree, grass, and weed pollen scores, over-the-counter medication use, and allergy specialist availability; Boise ranked #1, up from #95 in 2025).
- FOX Weather summary of AAFA's 2026 top ten (Boise, San Diego, Tulsa, Provo, Rochester, Wichita, Raleigh, Ogden, Spokane, Greenville), published March 10, 2026. https://www.foxweather.com/lifestyle/10-worst-allergy-capitals-us-pollen-allergy-season-longer-worse
- AAFA 2025 top five (Wichita, New Orleans, Oklahoma City, Tulsa, Memphis), as recorded in Pollen Atlas keyword research (accessed 2026-10-13/14).