
Atlanta Pollen Count Record: The Day Atlanta Hit 14,801
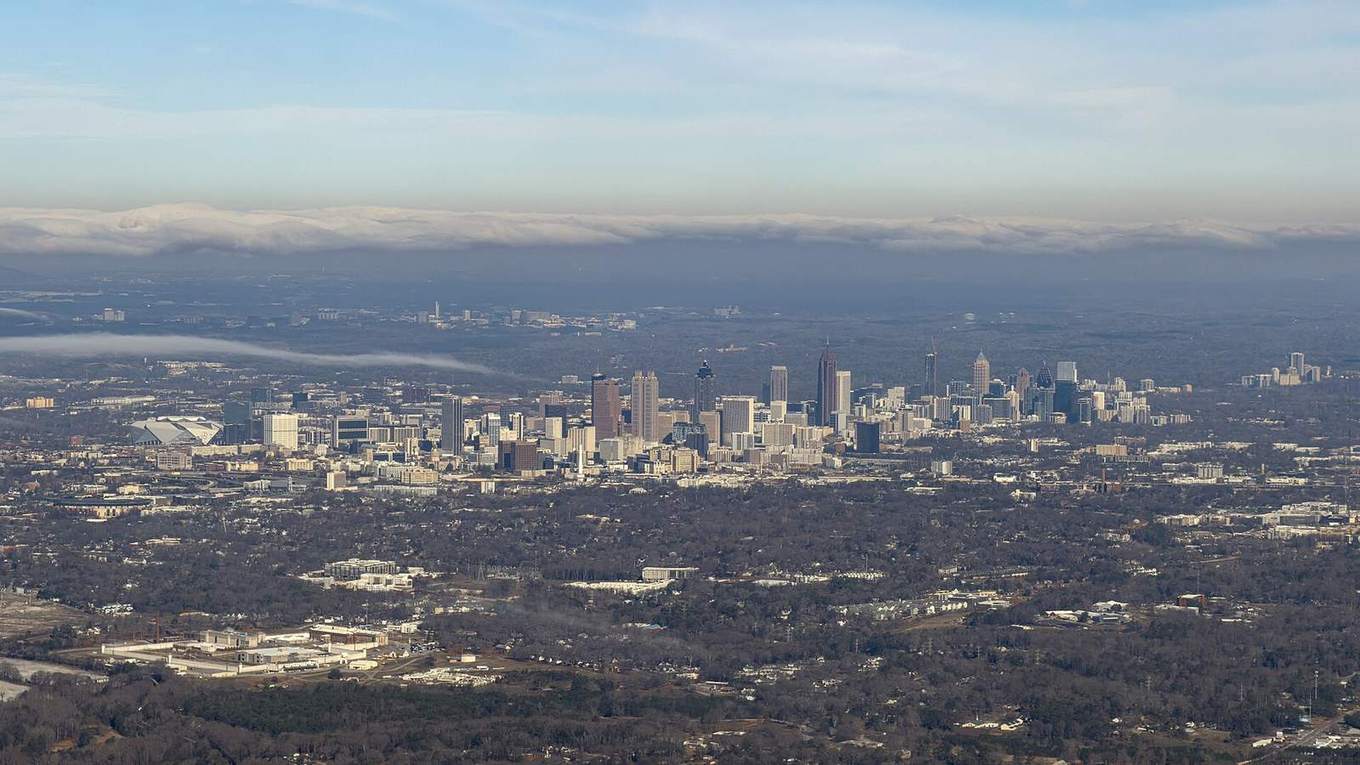
The atlanta pollen count is a number Atlantans check the way other cities check traffic, and on Saturday, March 29, 2025, it produced a result worth remembering. The atlanta pollen count reached 14,801 grains per cubic metre that day, according to Atlanta Allergy & Asthma (2025) — the highest reading in roughly 35 years of daily counting at the station. It was not a marginal new high. It cleared the previous record by thousands of grains, on a date that, just one year earlier, had been comparatively quiet. This is the story of that record, what drove it, and why a single number needs careful reading.
Key takeaways
- Atlanta's pollen count reached 14,801 grains per cubic metre on March 29, 2025, according to Atlanta Allergy & Asthma — the highest reading in roughly 35 years of daily counting at the station.
- The 2025 reading cleared the previous record of 9,369, set in 2012, by more than 5,400 grains, and was roughly nine times the 1,646 recorded on the same date in 2024.
- Atlanta Allergy & Asthma attributed the spike primarily to tree pollen, naming oak, pine, sycamore, sweet gum and birch among the drivers.
- The 14,801 figure is Atlanta's station record — it is not a world record, and it describes a historic day, not current conditions.
What the Atlanta pollen count actually measures
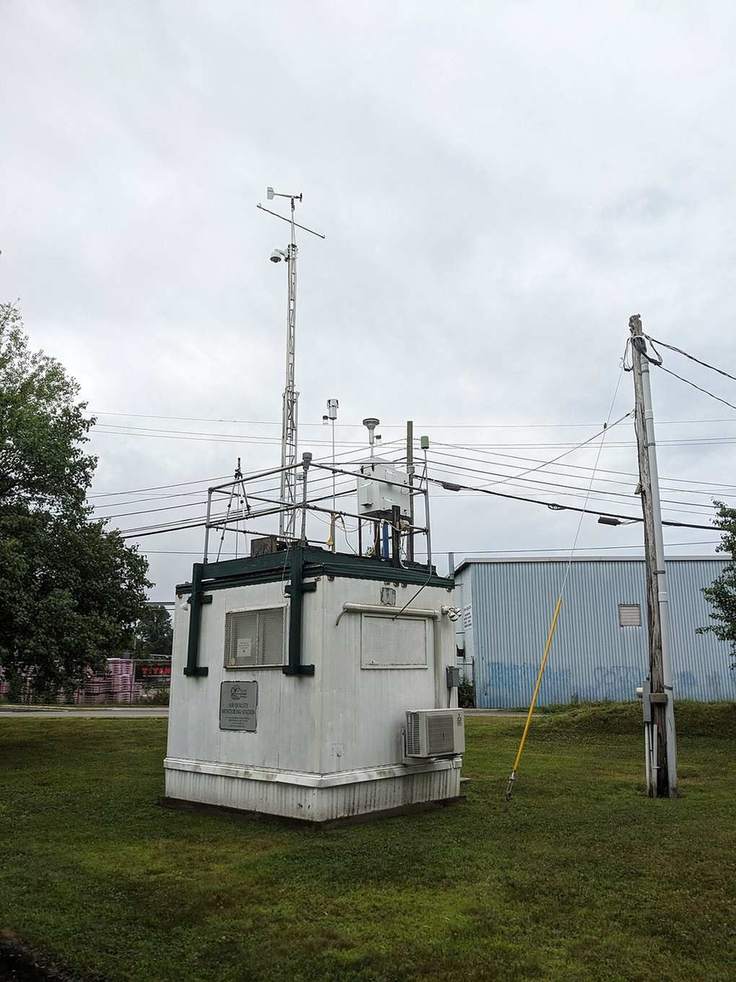
A pollen count is a measurement of how many pollen grains were found in a known volume of air over a set period, usually a day. Atlanta Allergy & Asthma has counted Atlanta's pollen daily for about 35 years (Atlanta Allergy & Asthma, 2025), which is what gives a record like this its meaning: the same local station, applying its counting routine over decades, can say with confidence when a day stands above every day it has measured before. Counting stations of this kind sit within a wider national system described by the American Academy of Allergy, Asthma & Immunology, whose National Allergy Bureau network is a long-standing reference point for how station counts are collected and reported in the United States.
Why local counting consistency matters
That local consistency matters, because counting methods differ from station to station. Equipment, placement, and counting practice vary, so a raw grain count from one city is not directly interchangeable with a raw grain count from another. For that reason, the 14,801 figure should be described exactly as what it is: Atlanta's station record. It is not a world record, and this article does not treat it as one.
Station counts and the Pollen Atlas index
It also helps to separate two kinds of numbers. A laboratory-style count is expressed in grains per cubic metre, which is how the 14,801 record is stated. Pollen Atlas translates local conditions into a simpler index for everyday planning: a 0 to 100 scale, with Low from 0 to 33, Moderate from 34 to 66, and High from 67 to 100, reported separately for trees, grass, and weeds, plus a total. If you want the fuller explanation of how counts and indexes differ, our guide to what a pollen count is and how to read one walks through it step by step.
The day the Atlanta pollen count broke its own record
Records are only interesting against the marks they replace, and Atlanta's old marks were already formidable. The previous record was 9,369 grains per cubic metre, set in 2012, according to Atlanta Allergy & Asthma (2025). That 2012 record, set on March 20, 2012, had itself beaten 6,013, recorded on April 12, 1999. In other words, the bar had been raised twice in 35 years — and then March 29, 2025 cleared the 2012 mark by more than 5,400 grains, a jump of well over half again.
| Date | Atlanta pollen count (grains per cubic metre) | Note |
|---|---|---|
| April 12, 1999 | 6,013 | Earlier record, beaten in 2012 |
| March 20, 2012 | 9,369 | Previous record before 2025 |
| March 29, 2024 | 1,646 | Same calendar date, one year earlier |
| March 29, 2025 | 14,801 | Highest reading in roughly 35 years of counting |
The same date in 2024 tells a different story
The sharpest comparison may be the calendar itself. On the same date in 2024, Atlanta recorded 1,646 grains per cubic metre (Atlanta Allergy & Asthma, 2025). The 2025 reading was roughly nine times that figure. Same city, same week of the year, same station — and a completely different atmosphere. That contrast is a useful reminder that a pollen season is not a fixed curve. Timing, temperature, rainfall in the weeks before, and the overlap of different trees releasing at once can compress what might have been several strong days into one exceptional one.
The record was visible, too. Weather.com reported on March 30, 2025 that yellow pollen was coating cars, porches, and even a creek across metro Atlanta. Anyone who has spent a Georgia spring watching a parked car turn yellow overnight will recognise that scene. The visible dust is only part of what a sampler measures, but on a day like that, the air and the evidence on every surface were telling the same story.
Tree pollen drove the spike

Atlanta Allergy & Asthma (2025) attributed the 2025 spike primarily to tree pollen, naming oak, pine, sycamore, sweet gum, and birch among the drivers. That list fits Atlanta's geography. The city sits in a heavily treed landscape, and in late March several major tree pollens can overlap rather than arrive in tidy sequence. When warm conditions bring multiple species to release together, the total can surge in a way that no single tree would explain on its own.
Pine: visible, but not the whole story
Pine deserves a clarifying note. Pine pollen is large, yellow, and conspicuous — it is a major part of the coating people see on cars and porches. Oak and the other broadleaf trees on that list contribute grains that are less visible to the eye but central to the count and to how the day feels for many pollen-sensitive residents. A record total is usually a chorus, not a solo.
If you want to understand the wider pattern behind a spike like this, our overview of tree pollen season and when different trees release pollen explains how the spring tree wave builds, peaks, and gives way to grass later in the year.
How Atlanta compares with other Southern cities
A record day in Atlanta invites an obvious question: was the rest of the Southeast breathing the same air? Raw station counts cannot answer that cleanly, for the method reason explained above. A fairer comparison is to look at each city on a common index scale on the same day.
That is the job of the Pollen Atlas city pages and the daily city rankings. Readers in Georgia should start with today's Atlanta pollen count, dominant allergen, and forecast rather than relying on the 2025 record as a guide to today — the record describes a historic day, not current conditions. To see how a Southeast tree wave is playing out regionally, compare it with Charlotte, North Carolina's pollen count and forecast and Nashville, Tennessee's pollen count and forecast. When Atlanta, Charlotte, and Nashville rise together, you are looking at a regional tree event. When Atlanta stands alone, local timing and weather are doing more of the work.
How to use a record number without overreading it
First, treat 14,801 as history and context, not as a forecast. It tells you what Atlanta's air is capable of in late March when tree pollens align. It does not tell you what tomorrow will bring, and it should never be quoted as a current reading.
Watch the pattern, not just the peak
Second, watch the pattern, not just the peak. A single High day on the 0 to 100 scale — High is 67 to 100 — is a planning problem for a day. Several High days in a row during tree season is a different kind of pressure, because exposure accumulates across the week. Checking the forecast each morning during late March and April gives you the sequence, not just a snapshot.
Third, pay attention to the dominant allergen. A total driven mainly by tree pollen calls for different expectations than a total driven later in the year by grass or weeds. The city page names the dominant allergen for exactly this reason, so a reader who knows trees are their difficult season can judge a spring spike differently from a fall one.
Finally, keep the human question separate from the record. This article is general information only and is not medical advice, and it makes no claim about how any individual felt, or should feel, on the record day. For plain-language background on seasonal allergies in general, the Asthma and Allergy Foundation of America publishes education resources for patients and families. If spring symptoms in Atlanta are a recurring and disruptive pattern for you, you can find an allergist near you through the Pollen Atlas directory and discuss your own history with a professional who knows it.
Frequently Asked Questions
What is the Atlanta pollen count record?
Atlanta's pollen count record is 14,801 grains per cubic metre, recorded on March 29, 2025. According to Atlanta Allergy & Asthma, it was the highest reading in roughly 35 years of daily counting at the station.
What was Atlanta's previous pollen count record?
The previous record was 9,369 grains per cubic metre, set on March 20, 2012. That record had itself beaten 6,013, recorded on April 12, 1999.
What caused the record Atlanta pollen count in 2025?
Tree pollen drove the 2025 spike, according to Atlanta Allergy & Asthma. Oak, pine, sycamore, sweet gum and birch were named among the drivers, with several tree pollens overlapping in late March.
How can I check the Atlanta pollen count today?
You can check today's Atlanta pollen count, dominant allergen and forecast on PollenAtlas.com. The 14,801 figure describes the historic record day in 2025, not current conditions.
Conclusion: what the Atlanta pollen count record teaches
The atlanta pollen count record — 14,801 grains per cubic metre on March 29, 2025, after 9,369 in 2012 and 6,013 in 1999, and against just 1,646 on the same date in 2024 — is a lesson in overlap. About 35 years of daily counting by Atlanta Allergy & Asthma (2025) gave the day its context, tree pollen from oak, pine, sycamore, sweet gum, and birch gave it its fuel, and a yellow coating reported by Weather.com (March 30, 2025) gave it its picture. Records like this are rare, but the habit that makes them useful is an everyday one: check your own city before you plan your day. See free pollen counts and forecasts for Atlanta and for cities worldwide at PollenAtlas.com — check the pollen before it checks you.