
What Is a Pollen Count? The Numbers Behind Your Forecast, Explained
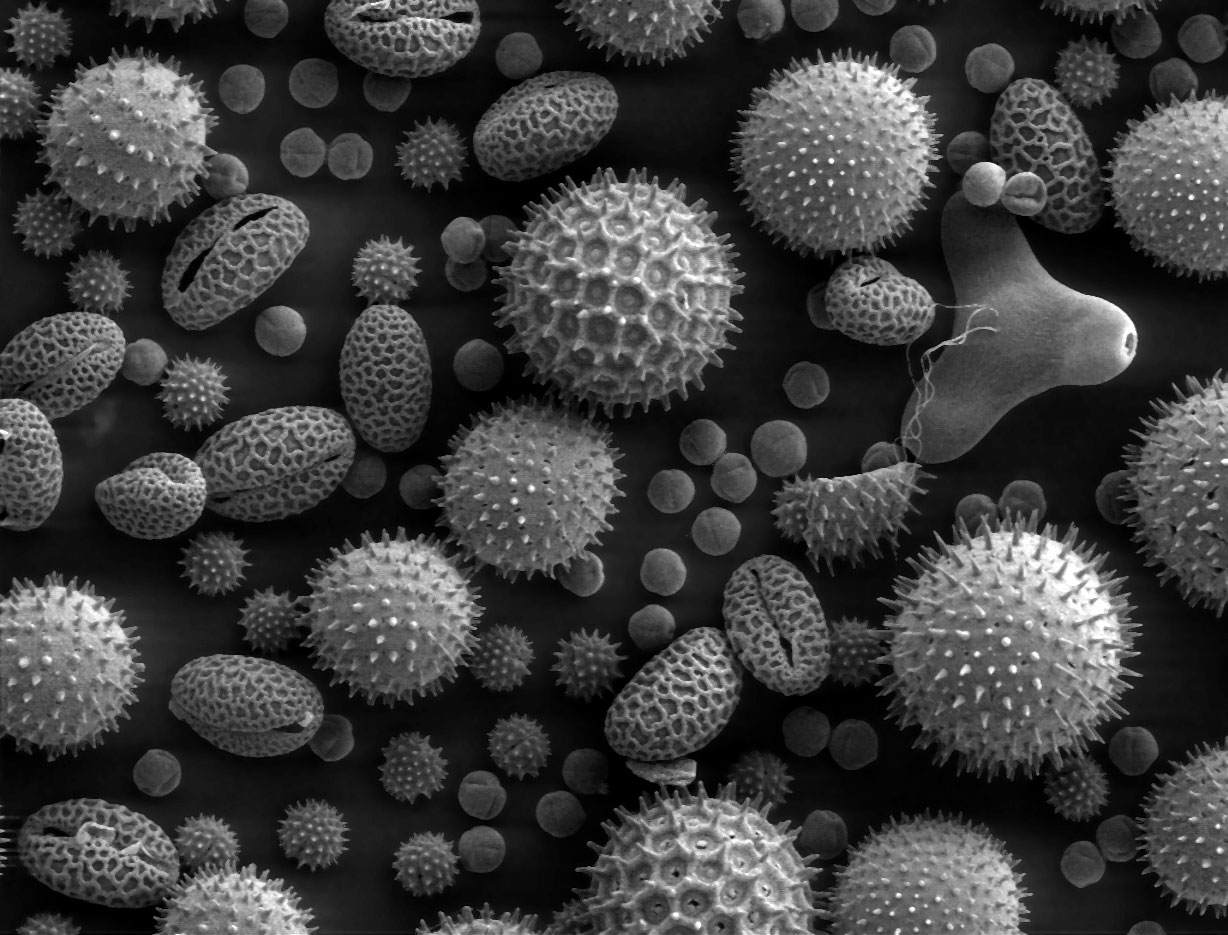
You check it like the temperature. A number appears next to your city, and you make a small decision: walk or drive, windows open or closed. But a pollen count is not like a temperature. No instrument reads it instantly, and the number on your screen is rarely a measurement taken that minute.
So what is a pollen count, where does it come from, and why do two websites sometimes disagree?
What a Pollen Count Actually Counts
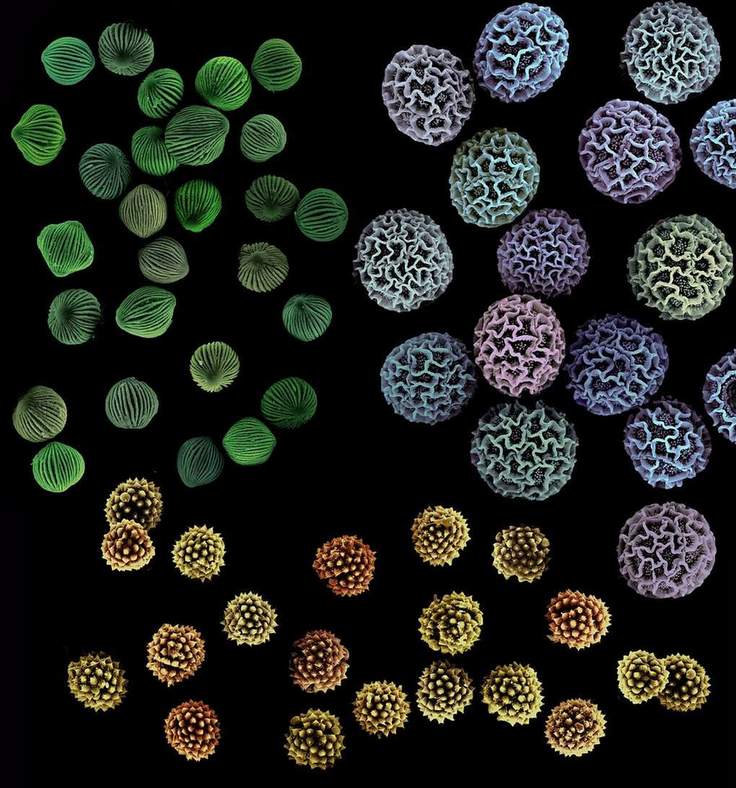
At its most literal, a pollen count measures how many grains of pollen are in a given volume of air over a given period. The standard unit is grains per cubic metre of air, usually averaged over 24 hours.
Picture a box of air the size of a large wardrobe. If a sampler draws that much air through it over a day and a counter finds several hundred grains trapped inside, that density is the count. It is a physical quantity, not a rating — a description of how crowded the air was during sampling.
Two complications follow. First, "pollen" is not one thing. Tree, grass, and weed pollen — ragweed is the best-known weed example — come from different plants, peak in different seasons, and affect different people. A total can hide which type did the damage. Second, a raw grain count is hard to interpret. Is 800 grains per cubic metre bad, compared with yesterday, another city, or the worst day of the season?
That is why most consumer forecasts, including Pollen Atlas, translate it into an index: pollen levels rescaled onto a familiar 0–100 scale, so days and places can be compared at a glance. You gain readability; you lose the raw unit. An index is a summary built for decisions, not a laboratory measurement.
When people ask what a high pollen count is, they usually mean that translated number — the level at which the air carries enough of the relevant pollen that many sensitive people are likely to notice it. There is no universal grain threshold for every plant and person, which is why indexes use bands rather than pretend to offer a medical cutoff.
A Short History: Counting on Glass Slides
In the 1870s, English physician Charles Blackley, a hay fever sufferer himself, tested whether pollen caused his symptoms by coating glass slides with a sticky preparation, exposing them to the air — some flown aloft on kites — and counting the trapped grains under a microscope. Slow and patient, it is still the basic idea today: trap what the air carries, then count it grain by grain. Accuracy takes time.
How Pollen Counts Are Traditionally Measured

Most official counts begin with a sampler on a rooftop. A volumetric trap draws in a known volume of air continuously and deposits what it carries onto a moving, coated surface. A Rotorod sampler instead spins coated rods through the air, and pollen sticks as they rotate. Either way, the device only collects a sample. It counts nothing itself.
A person does the counting. At certified counting stations, trained counters examine the sample under a microscope and identify grains by shape and surface features — size, pores, and texture are clues — so they can report a breakdown by plant type, not just a total. In the United States, many stations belong to the National Allergy Bureau network, the NAB, whose certified counters follow standardised procedures.
That human step is the system's strength and bottleneck. A microscope count is the reference standard: someone actually saw those grains. But it cannot be rushed, expertise is scarce, and stations are limited. Your nearest may be in another city — sampling its air, not your street's.
Why Many Published Counts Are a Day Behind
A sampler typically needs a full period — commonly 24 hours — before there is a complete sample to examine. Then it must be prepared, counted, checked, and reported. If any step waits for business hours or a weekend, the delay grows. By publication, rain may have washed the air clean, or a new release may be under way.
This is not carelessness; it is the cost of a measured number, not an estimated one. Still, ask of any count: is this what was measured, or what is expected?
From a Count to a Forecast: The Modelled Part
No trap can sample the future, so forecasts combine several inputs. Station counts anchor them — recent observations of what plants released, and how much. Weather moves and triggers it: wind carries pollen, rain tends to wash it from the air, and warm, dry conditions generally favour release. Plant data supplies the calendar and map: which species grow where, and where each sits in its season. Some systems add satellite and plant-distribution data for regions with no station at all.
Pollen Atlas displays per-plant information from modelled sources of this kind, including the Google Pollen API, alongside its own presentation of overall levels. So a per-plant forecast for a city with no nearby station is a modelled estimate — an informed calculation from plants, season, and weather — not a microscope count from that city. Modelling makes a local forecast possible at all, but it should not sound more certain than it is. Honest label: measured where a station counted, modelled where a system estimated, and most daily forecasts blend both.
How Pollen Atlas Presents It: The 0–100 Index
Pollen Atlas data shows pollen levels as a Total Pollen Index from 0 to 100, with separate Tree, Grass, and Weeds indexes on the same scale. The total answers "how much overall?" The splits answer the better follow-up: "which kind?"
| Index value | Band | What it generally means |
|---|---|---|
| 0–33 | Low | Relatively little pollen; a lighter day for most people |
| 34–66 | Moderate | A noticeable amount; a day to be aware, especially if you know your triggers |
| 67–100 | High | Heavy levels; sensitive people are more likely to feel it |
The bands describe the air, not you — two people can experience the same index very differently. The split can matter more than the total: a moderate day driven almost entirely by the one pollen you react to may matter more than a higher total of types that do not bother you. And an index is chiefly a comparison tool: today versus yesterday, this week versus last, your city versus where you are travelling.
A city page also shows a 5-day forecast and a dominant allergen — the pollen type expected to account for the largest share. The forecast lets you plan across a week instead of reacting each morning; the dominant allergen tells you in one phrase whether a high day is a tree story, a grass story, or a weeds story.
How to Read a City Page
Start with the total, then the split. If you read only one combination, make it the Total Pollen Index plus the dominant allergen: how much, and of what. Then scan the 5-day forecast for the week's shape. A lone high day between low ones suggests timing plans around it; a rising run suggests a stretch to prepare for, not a blip.
Finally, zoom out. The pollen heatmap shows how levels vary nationally that day, and the city rankings show which places carry the heaviest levels — context for whether your city's bad day is local or part of a wider pattern. The format is consistent everywhere: compare New York, Dallas, and Phoenix, and the same structure covers very different plant mixes and seasons. Learn one page, and you can read any of them.
Why Two Sources Can Show Different Numbers
If one app calls a day "high" and another calls the same city "moderate," neither is necessarily wrong. They may not be measuring the same thing.
- Measured versus modelled. One source reports a station's microscope count; another shows a modelled estimate for your exact location. Both are legitimate — and different kinds of number.
- Station distance. A count comes from one sampler in one place. Levels vary across a metro area, and a distant station's air may be greener, drier, or more built-up than yours.
- Different scales. A raw grain count, a 0–100 index, and a low-to-high label cannot be compared directly. Two services can agree on the air and display numbers that look nothing alike.
- Update timing. One source has published this morning's estimate; another still shows a count that finished sampling yesterday. On a fast-changing day, timing alone can flip a band.
- Plant mix and method. Services cover different species, weight them differently, and blend weather in differently. Small choices show up on borderline days.
This honesty is a feature. Pollen is a living, moving thing, and a source presenting it as exact to the last digit is telling you more about its marketing than its method. What you want is a clear scale, a stated plant breakdown, and consistent day-to-day terms.
How to Actually Use the Number
A count earns its place in your morning when it changes a decision, however small. Treat it as a planning input, like the chance of rain.
Check before you commit, not after. The 5-day forecast can inform which day suits a long outdoor event, a run, gardening, or open-window sleeping — choices easier to shift in advance than undo. Timing within a day helps too: if levels tend to ease later or after rain, pick a better window instead of abandoning the plan.
Above all, follow your own pollen type. Once you know whether trees, grass, or weeds are your main issue, the splits become your headline and the total becomes background. A low total with your type climbing is a better warning than a high total unrelated to you.
For broader, general information on living with high-pollen days, see Pollen Atlas's health recommendations. That page is general information, not medical advice — and so is this explainer. Questions about your own symptoms, testing, or treatment belong with a qualified clinician.
The Bottom Line
A pollen count begins as something concrete: grains caught from a known volume of air and counted under a microscope, much as Blackley counted them a century and a half ago. By the time it reaches your screen, weather, plant maps, and modelling have extended it into a forecast, translated into an index you can read in two seconds.
That does not make it fake — just more usable and a little less literal. Read it in layers — index for the quick decision, splits for your pattern, dominant allergen for the story behind the day, 5-day forecast for planning — and it becomes what it should be: a well-explained estimate that helps you plan your day.