
How Pollen Counts Are Measured: From Rotorod to Real-Time Data
How pollen counts are measured is a story that starts with a Victorian doctor flying sticky glass slides on kites and ends, for now, with lasers and computer models. In between sits the method that still anchors the science: a trap on a rooftop, a known volume of air, and a trained human being counting grains under a microscope, one by one. If you have ever wondered why a published count describes yesterday's air, why the nearest counting station may be in another city, or why two services can disagree about the same day, the answer is in how pollen counts are measured — step by step, this is the whole chain. Our companion pillar, What Is a Pollen Count?, explains how to read the finished number; this article explains how the number is made, and deliberately goes deeper into method and history rather than repeating the reader's guide.
Key takeaways
- How pollen counts are measured still follows Charles Blackley's 1870s template: trap a representative sample of air, identify what is in it, and express the result as grains per unit volume.
- The classic Hirst-type trap draws a known volume of air — 10 litres per minute — onto a moving adhesive tape, so a single tape can be read hour by hour.
- Certified human counters still identify grains under a microscope at National Allergy Bureau stations, which is why a published count typically describes the previous 24 hours.
- Pollen Atlas data shows the figures most people use blend station counts with modelling, so a measured count, a modelled estimate, and an automated reading are three different kinds of number.
How Pollen Counts Are Measured: Blackley's Slides
The founding experiment belongs to Charles Blackley, an English physician and hay fever sufferer who in the 1870s set out to prove that pollen — not heat, dust, or odour, the suspects of the day — caused his symptoms. His method, published in his 1873 book on hay fever, was beautifully direct: coat glass slides with a sticky preparation, expose them to the air (some raised aloft on kites to test whether pollen travelled at height), then count what stuck under a microscope.
Testing pollen at height — and on himself
Blackley also built an early self-recording device to catch grains over time, and he tested himself directly, inhaling measured pollen and recording the result. The conceptual template he set has never been replaced, only refined: trap a representative sample of air, identify what is in it, and express the result as grains per unit volume. Every modern station, however automated its front end, is still answering Blackley's question Blackley's way.
How Pollen Counts Are Measured: The Trap
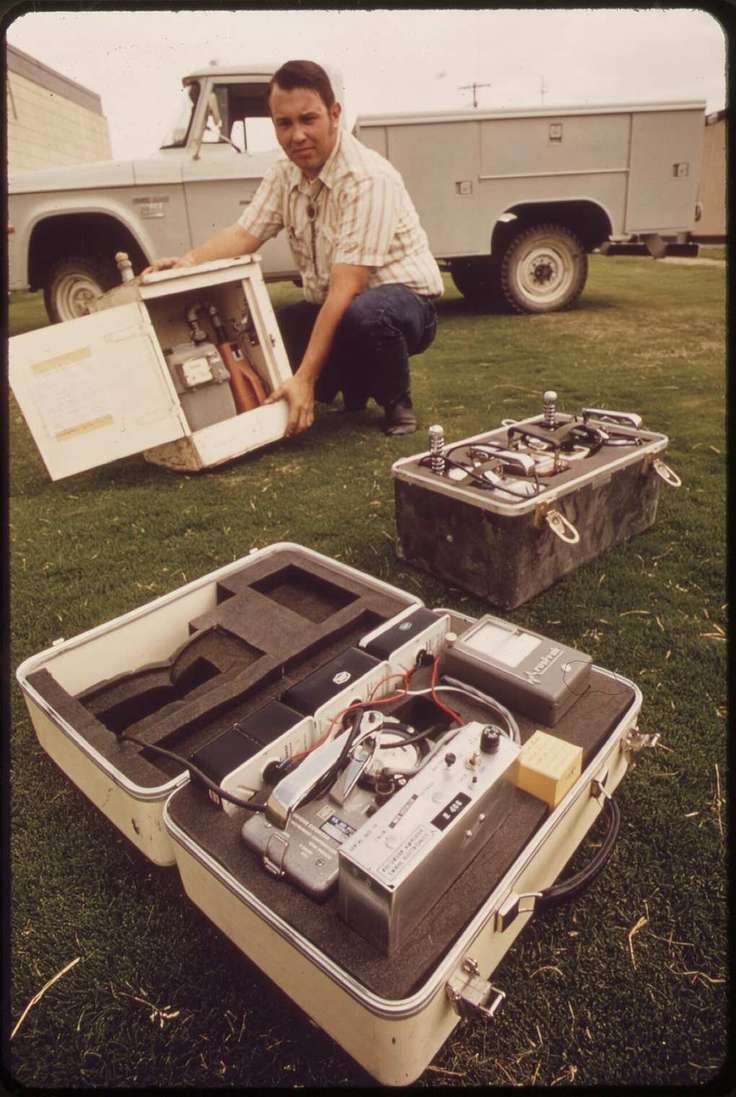
The twentieth century industrialised the slide. Three sampler families matter most.
Gravity and Durham samplers. The simplest devices expose a coated slide horizontally and let particles settle onto it. Cheap and sturdy, they under-sample small grains and depend on calm air, so they were largely superseded for official counts — though their long historical records remain valuable.
The Hirst trap. In 1952, J. M. Hirst published "An automatic volumetric spore trap" in the Annals of Applied Biology (1952) — the design, later manufactured in Burkard form, that became the standard across Europe and much of the world. A pump draws a known volume of air (the classic Hirst-type rate is 10 litres per minute) through a narrow slit onto a slowly moving adhesive tape or slide, so the deposit is time-stamped by position: you can read the day hour by hour off a single tape. A modern standardisation review in Aerobiologia — Towards standardisation of automatic pollen and fungal spore monitoring — still treats the Hirst-type sampler as the reference design that newer automatic devices are calibrated against.
The Rotorod. The workhorse of the United States network works differently: coated rods on a rotating arm spin through the air at high speed, and pollen impacts onto the rods as they sweep. Retracted between sampling intervals to save the coating, the rods are then removed for microscopy. It is volumetric in its own way — the volume swept can be calculated — and it made a national network of stations practical.
| Sampler | How it collects | Notes |
|---|---|---|
| Gravity / Durham sampler | Particles settle onto a coated slide | Cheap and sturdy, but under-samples small grains; largely superseded for official counts |
| Hirst / Burkard trap | Pump draws a known volume of air (10 litres per minute) onto a moving adhesive tape or slide | The standard reference design across Europe and much of the world since 1952 |
| Rotorod | Coated rods on a rotating arm sweep through the air and pollen impacts onto them | The workhorse of the United States station network |
| Automatic monitors | Laser scattering, digital holography, and fluorescence with image-recognition software | Near-real-time readings; not yet the reference standard |
What every sampler has in common
What all three share is the step that matters: none of them identifies anything. They collect. Identification still happens at the microscope.
The Microscope: Where a Sample Becomes a Count
At a certified station, a counter examines the tape, slide, or rods under magnification and identifies grains by morphology — size, shape, the number and arrangement of pores and furrows, and surface texture. Oak looks nothing like ragweed under the microscope; grass pollens, frustratingly, look very much like each other, which is why grass is usually reported as a family rather than a species.
The American Academy of Allergy, Asthma & Immunology explains the standard workflow in Hay Fever and Pollen Counts: an instrument, usually on a rooftop, collects spores and pollen over a 24-hour period, and the collected material is then taken to a lab and analysed for pollen types and concentration. The AAAAI's National Allergy Bureau (NAB) is the network of such stations reporting current pollen and mold levels across the United States, and its counters must meet certification standards — a 2023 review of NAB monitoring by Levetin and colleagues in the Journal of Allergy and Clinical Immunology: In Practice (2023) describes the bureau's history and its role as the country's reference aeroallergen network.
Why human counting is slow but trusted
This human step is why counts are trustworthy and why they are slow. A complete sample needs its full sampling period; then it must be prepared, counted, checked, and reported. The count that reaches the public typically describes the previous 24 hours — measured air, not this morning's air.
From Station Counts to the Number on Your Phone
A rooftop in one part of a metro area cannot describe every street, and most cities have no station at all. So the daily figures most people actually use — including for cities like New York, Dallas, Phoenix, and Atlanta on Pollen Atlas — blend station counts with modelling: plant distribution maps, season calendars for each species, and weather that releases, carries, or washes out pollen. Programmes such as the Google Pollen API build per-plant estimates this way, and Pollen Atlas presents its 0–100 indexes from modelled data of this kind. The city rankings compare those modelled city figures on a consistent basis, so cities can be ranked even where no microscope exists.
Automatic monitors and near-real-time counting
The newest chapter is automation. Automatic monitors using laser scattering, digital holography, and fluorescence, paired with image-recognition software, can identify grains in near-real time — the Aerobiologia standardisation literature is largely about how to validate these devices against Hirst-type references. They promise counts that are hours old instead of a day old. They are not yet the reference standard, because identifying a grain from a hologram is a harder problem than identifying its arrival.
Methodology transparency matters for a practical reason: a measured count, a modelled estimate, and an automated reading are three different kinds of number, and honest services say which one they are showing. If your pattern of symptoms seems to involve a specific plant, that distinction is also a good topic for a clinician — you can find an allergist near you in the directory. And to see how station points and modelled fields become a national picture, read our guide to the allergy map.
Frequently Asked Questions
How are pollen counts measured?
Pollen counts are measured by trapping a known volume of air — with a Hirst-type trap or a Rotorod sampler — and counting the collected grains under a microscope. The result is expressed as grains per unit volume of air.
What is the National Allergy Bureau?
The National Allergy Bureau (NAB) is the AAAAI's network of certified counting stations reporting pollen and mold levels across the United States. Its counters must meet certification standards, and it serves as the country's reference aeroallergen network.
Why does a pollen count describe yesterday's air?
A complete sample needs its full sampling period, then preparation, counting, checking, and reporting. Because identification still happens at a microscope, the count that reaches the public typically describes the previous 24 hours.
What is the difference between a measured count and a modelled estimate?
A measured count is real grains counted from sampled air at a station, while a modelled estimate blends station counts with plant distribution, season calendars, and weather to cover cities with no station. Honest services say which kind of number they are showing.
The Bottom Line on How Pollen Counts Are Measured
How pollen counts are measured still comes down to Blackley's bargain: real grains, really counted, in exchange for time. Traps — Hirst, Burkard, Rotorod — catch the air; certified counters name what they caught; models then carry that truth outward to every city and forward into forecasts, and automated counters are closing the time gap piece by piece.
Knowing which kind of number you are looking at makes you a better reader of all of them. Start with your city — free pollen counts and forecasts, worldwide, at PollenAtlas.com.