
Sydney, Australia Pollen Count
Sydney, Australia · Last updated Friday, November 6, 2026
This page shows the most recent reading available for Sydney — from Friday, November 6, 2026 (1 day ago) — not today's reading.
Pollen Overview
Today's overall pollen level and the dominant type (trees, weeds, grass, or mold).
Total Pollen Index
The combined pollen level across all types (0–100).
Sydney, Australia
Weeds Index
How active weeds pollen is today (0–100).
Sydney, Australia
Pollen Types
Pick a pollen subtype to update the species forecast
5-Day Sydney Overall Pollen Forecast
Bars are colored by severity (Low/Moderate/High).
Pollen count Sydney residents check each morning
The Sydney pollen count today is 14 (Low). The main driver is Ragweed, with weed pollen at 14 today. Grass pollen is the highest single category in the split at 15 (Low), ahead of weed pollen at 14 and tree pollen at 10. Below, the plant detail and the multi-day outlook show whether today is the pattern or the exception. Pollen Atlas updated this count on Friday, November 6, 2026.
A Low band on the Pollen Atlas index means the Total Pollen Index has stayed in the lower part of the 0–100 scale. Readings in this band are built from low individual category values rather than from one large spike, and the category split above matters more than the headline number: a low total can still contain one category, such as grass pollen, reading noticeably higher than the rest, which is why the split is printed on every Sydney page.
Fall is ragweed season across most of the United States: ragweed plants release pollen from late summer into autumn, and weed pollen is typically the last major outdoor pollen category to fade as the weather cools. That pattern is why an autumn total is so often weed-led even when the headline number is low — tree and grass pollen have usually receded by then, leaving weed pollen, and on damp days mold, to make up most of what the index records.
To see whether today’s pollen level holds, check the 5-day Sydney pollen forecast below — it is currently rising, with Sunday the highest day in the window.
This is the pollen count Sydney residents check each morning, built from the day’s tree, grass, weed and mold readings.
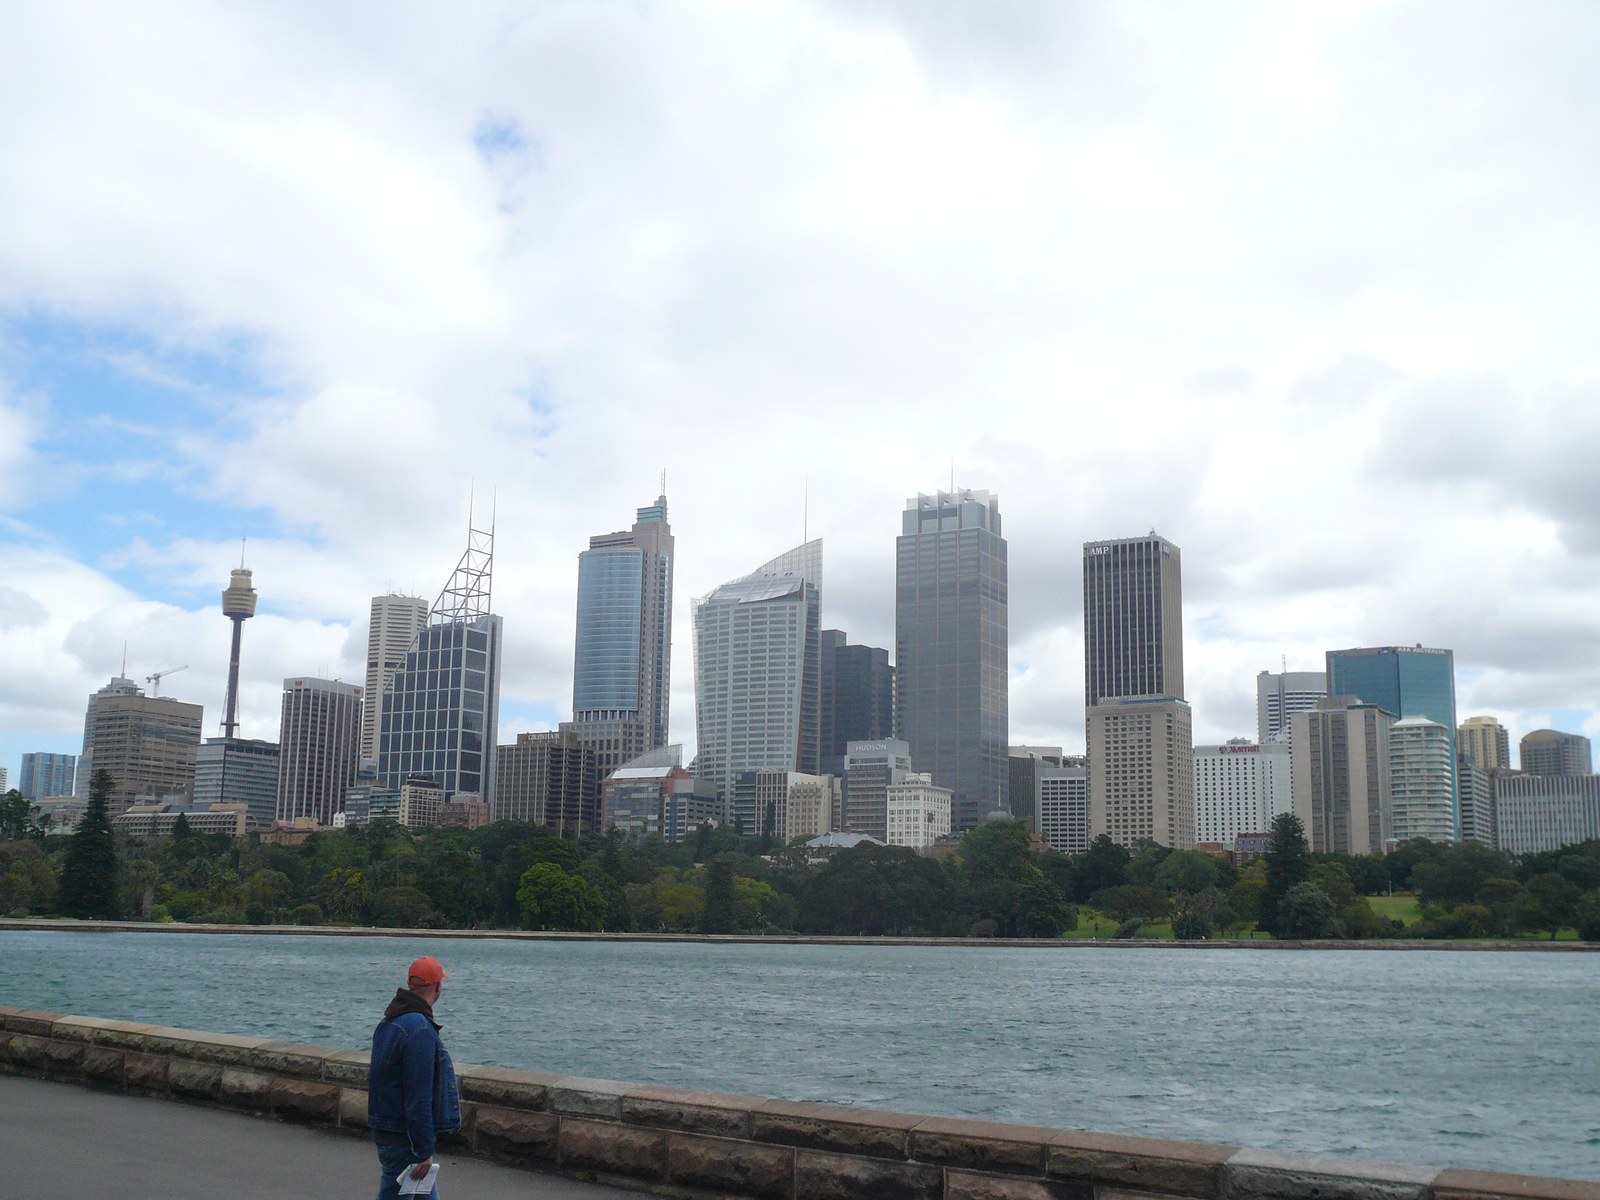
What is the Sydney pollen count today?
The Sydney pollen count today is 14 out of 100 (Low) on the Pollen Atlas Total Pollen Index, driven mainly by Ragweed.
Short answer for anyone searching pollen count today Sydney: this page is updated every morning with the day’s modelled reading.
Sydney allergies today
Sydney allergies today are set by the same reading as the pollen count above: the Total Pollen Index is 14 (Low), driven mainly by Ragweed. When people ask about Sydney allergies, this is the number that answers them — one daily index built from today’s tree, grass, weed and mold readings for Sydney.
Allergies in Sydney follow the Australia calendar set out below — the chapters, the plants behind them, and the 5-day forecast on this page show whether today is typical for the season or an exception to it. If you are checking allergies today in Sydney before heading outdoors, the split at the top of this page is the part to read: it shows which pollen is doing the work today, not just how high the total sits.
Read the five-day table on this page as the Sydney allergy forecast: today reads 14 (Low), and the day-by-day outlook shows whether Sydney allergies are set to ease or build across the week — the days to plan outdoor time around are the ones where the index steps down, not just today.
In practice, the allergy count Sydney today records is this same combined reading — tree, grass, weed and mold in one index.
The Sydney allergy count today is 14 (Low) — the same Total Pollen Index as the pollen count above, in one combined reading.
Pollen count today Sydney: the 5-day forecast
| Day | Total Pollen Index | Band |
|---|---|---|
| Friday, November 6 | 14 | Low |
| Saturday, November 7 | 20 | Low |
| Sunday, November 8 | 29 | Low |
| Monday, November 9 | 29 | Low |
| Tuesday, November 10 | 29 | Low |
Pollen Atlas forecasts Sydney’s pollen count to peak on Sunday at 29 (Low) over the next 5 days.
Pollen by type in Sydney
What is driving Sydney’s pollen today
The shape of today’s 14 (Low) is set by grass pollen at 15 (Low on its own scale) — about 38% of the four category readings added together, 1 points clear of the next category, weed pollen at 14. Grass-led totals tend to hold a level for days at a time rather than spike and clear, because grasses pollinate over an extended period. Grass pollen leading in November is a modelled reading, reported as modelled — no regional calendar is asserted for Australia, and the modelled value outranks any general seasonal expectation.
In the plant detail, Grasses (grass) carries the strongest single plant reading, at a Universal Pollen Index of 3 (Moderate), followed by Cypress Pine at 1. No Australia allergy season guide is published yet to cross-reference these names against — they are today’s measured plant detail for Sydney, ranked by plant index.
Across the five-day window the Total Pollen Index runs from 14 to 29, never changing band. Today’s 14 sits 10 points below the window’s average of 24.2 — a moving window, worth reading day by day rather than from the average.
Plants affecting Sydney now
Two plants are listed in today’s detail for Sydney, shown highest plant index first.
- Grasses (grass): Universal Pollen Index 3 (Moderate) — in season
- Cypress Pine (tree): Universal Pollen Index 1 (Very Low) — out of season
Every pollen type, with photos and seasons: the pollen directory.
Sydney pollen through the year
Three chapters make the Australia pollen year, and Sydney follows them in the Global order. The tree chapter: tree pollen seasons vary with local climate and vegetation, so this page reports the measured readings first and treats any calendar as background only. The grass chapter: grass pollen seasons vary with local climate and vegetation, and the measured value outranks any general seasonal expectation. The weed chapter: weed pollen seasons vary with local climate and vegetation, and no regional calendar is asserted for this area.
No Australia allergy season guide is published yet, so this page does not single out signature pollens for Sydney — the calendar above is the Global regional pattern, and the plant detail on this page names what today’s feed actually records.
November in Sydney is reported from its modelled readings, not from a regional calendar — no regional calendar is asserted for Australia, so the calendar alone explains little today, and the modelled split above carries the story. No Australia allergy season guide is published yet — this calendar follows the Global regional pattern. See Sydney pollen count rankings and Sydney on the pollen heatmap.
How to read this index
Pollen Atlas reports the Sydney pollen count on a Total Pollen Index from 0 to 100, built from separate tree, grass and weed readings. The total is a summary, not an average of the three: a single strong category can lift it, and three quiet categories can hold it down even in a month when Sydney, Australia pollen is usually more active. Index values are a modelled pollen risk index computed by Pollen Atlas from open weather, vegetation and phenology data, calibrated against CDC/NAB season data, with plant detail by the Google Pollen API. The index is a modelled 0–100 scale, not a measured count, and figures update through the day, so a morning and an evening visit to this page can legitimately show different numbers.
Sydney in today’s national picture
At 14 (Low), Sydney ranks joint 71898th of the 90896 cities Pollen Atlas tracks today — in the middle of the national table. The highest reading in the country today is Beja, Portugal at 52, and the lowest is Los Ángeles de San Rafael, Spain at 5. The whole table spans 47 points today — a wide-open day, when the top and bottom of the table are effectively in different seasons.
Around Sydney: Central Coast, Australia (51 km away) reads 15 (Low); Wollongong, Australia (68 km away) reads 18 (Low); Newcastle, Australia (117 km away) reads 13 (Low). Sydney reads 1 point lower than its nearest tracked neighbour today. Across Australia’s 15 tracked cities, today runs from 13 in Newcastle to 34 in Brisbane.
Pollen totals are population numbers; symptoms are personal. The same reading can leave one Sydney resident untouched and floor another, depending on which pollens they are sensitised to. If this pattern finds you every season, allergists in Sydney, Australia can test whether tree, grass, weed or mold is the category that matters for you — the four readings at the top of this page are the starting point for that conversation.
Sydney in its local area
Sydney is in New South Wales, Australia. Its population is 5,638,830 (GeoNames).
Across Australia’s 15 tracked cities, Sydney ranks 14th today.
Like every Pollen Atlas city page, the Sydney, Australia pollen count is refreshed each morning.
Nearby cities
- Central Coast pollen count (51 km away)
- Wollongong pollen count (68 km away)
- Newcastle pollen count (117 km away)
- Canberra pollen count (247 km away)
- Gold Coast pollen count (686 km away)
- Melbourne pollen count (713 km away)
From Pollen Atlas News
See how Sydney ranks in today's pollen count rankings — the worst cities for allergies today
Pollen indexes: a modelled pollen risk index computed by Pollen Atlas from open weather, vegetation and phenology data, calibrated against CDC/NAB season data. Plant detail: Google Pollen API. Index values are modelled, not measured counts. Sources: CDC/NAB; USA-NPN; GBIF (CC BY); ESA WorldCover (CC BY 4.0).